Burning money – the cost of fire
Now that we know enough to understand how a sprinkler system works perhaps we should take a closer look at some of the statistics on hand around fires and sprinklers in South Africa. With the numbers available from the Fire Protection Association of South Africa (FPASA) there are some alarming statistics presented. The most recent statistics are only available for two years previous and at the time of writing the most recent information was not readily available. It takes a lot of time and effort to gather and analyse data from all the sources available. Bear in mind that the statistics are taken only from what is reported which leaves one to wonder how bad the situation really is.
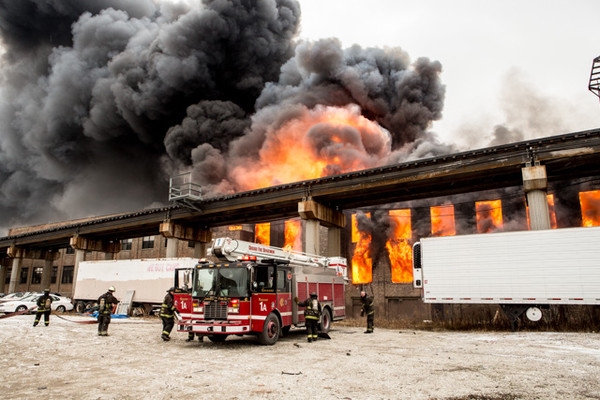
In 2015 there were a reported 45 784 fires, or an average of 124 per day! So, the phrase of “not if but when (a fire breaks out)” seems to hold some clout with regard to the building and insurance industries. While the cause of 44% of those fires is unaccounted for, the next three causes are listed as:
-
- 33% – arson
- 8% – electrical
- 4% – smoking
This paints a picture that a large number of fires are pre-meditated; preventing arson is not as easy to do as you might think. Anything and everything is a target and most materials burn, as the recent metro trains set alight in Cape Town prove.
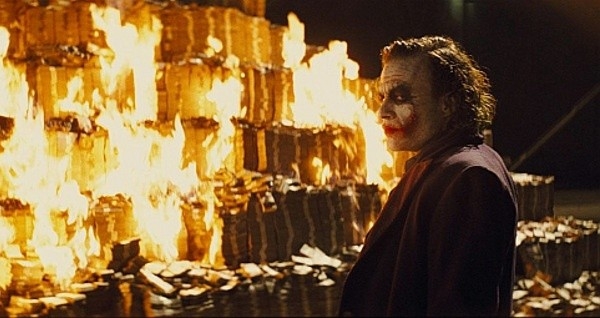
With such a large number of fires in 2015 what is the rand value in damage, you might ask? A staggering R2 732 000 000. Or, for those not gifted in translating numbers to words, R2.7 billion of damage was incurred in 2015. An aspect of these losses that many people overlook is that that amount of money is essentially taken out of the economy. Think of the benefits almost R3 billion could have on any area of the economy and then watch it go up in flames instead.
Moving towards areas that ASIB has an impact on, namely, fixed fire protection in the regulated commercial space, the industrial number of fires and losses are listed at 824 and R428 018 082 respectively. Just 1.8% of fires account for 16% of the rand value of losses. Perhaps, now we can see why it is so important to pay attention to these stats. From an insurer to a client to a fire industry operator, the need for proper standards and installations is obvious. On that note, a building that has been issued an ASIB Clearance Certificate (a standard created by ASIB) has never been lost to a fire – the sprinkler system always managed to do its job and mitigate the damage. How’s that for an impressive track record?
The statistics from 2015 can be viewed below in the PDF document – please note you can drag the screen to view double pages.
[pdf-embedder url=”https://www.cnandco.com/wp-content/uploads/2018/09/JUNE-2017-STATS-FOR-LIBRARY.pdf” title=”Fire statistics released for 2015″]
In this series to date:


