
Lightstone sheds light on property prices
We work with an interesting and diverse group of clients. One of our most established clients, Lightstone Group, crunches massive amounts of data relating to the property and automotive markets and generates some fascinating insights – used by nearly all the banks and estate agents in the country.
We love how they quietly support their partners to be famous – runs in the family it seems! Parent company Halls Group also has interests in the Insurance Supermarket, AllLife and various property and fresh produce companies locally, in Europe and further afield. All while keeping a low profile, doing good for communities and supporting a values-driven business. No wonder they’ve been around for over 125 years!
Here’s the latest Lightstone report…
———————————————
The Lightstone house price forecast for 2017: it’s a buyer’s market
The Lightstone house price forecast for 2017 is out, and it’s looking great… if you’re a buyer. This year we predict slow to sluggish growth in house prices of between 0.2% and 2,3%. In 2016 we predicted a 3.5% increase in house price growth, once again our prediction came remarkably close – the year ended off on 3.4%.
This prediction comes on the back of a very interesting 2016. Nationally house price inflation dropped to 3,4% in 2016 from 5,3% at the end of 2015. The downward trend is notable, but digging a little deeper into that number reveals an even more interesting statistic: There was a significant divergence between 2016’s house price inflation figures in the Western Cape (8,7%) and Gauteng (2,5%).
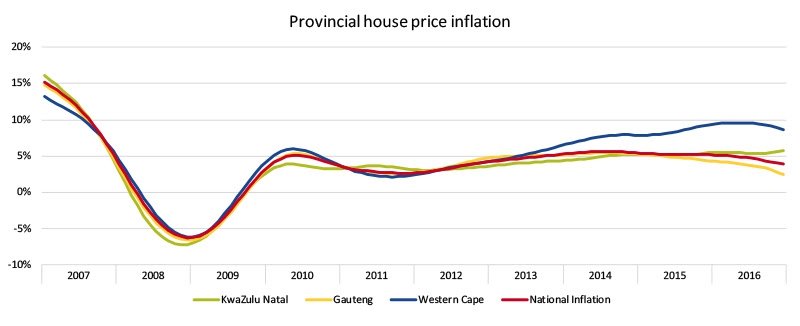
Paul-Roux de Kock, Analytics Director at Lightstone suggests that “the trends divergence from the other provinces’ inflation in the Western Cape is driven largely by sales in the City of Cape Town and it could be closely linked to increased migration to the Western Cape”. This is an important trend to factor into any forecast as it suggests provincial house price estimates might differ substantially, not only by value band but also by province.
And so, on to the forecast…
As with any crystal ball gazing, there are always going to be a whole lot of assumptions and exclusions. To reach the national house price inflation prediction for 2017, we drew on our extensive historical data and years of experience in crunching numbers in the property sector. Here’s how we derive our predictions:
Price banding
Based on trends in previous years, luxury house prices tend to lead the way. A slowdown in inflation in this sector, for example, usually heralds lower inflation at national level. Similarly, the low- and mid-value inflation indices tend to lag behind the national house price inflation index.
For the 2017 house price inflation prediction, we use data from property sales up to R3-million. Anything higher, inflation tends to be more unpredictable. In this price range there are factors that don’t affect the rest of the market, such as demand for properties by foreigners and coastal investment properties.
We have three price bands:
Less than R1-million (low-value)
R1-million to R2-million (mid-value)
R2-million to R3-million (luxury)
Each band’s inflation index is compared with the national index. The results are plotted in the graph below. Mid-value and luxury prices are on a downward trajectory, while the low-value segment is still rising, effectively lagging behind the national trend (in line with the trend!)
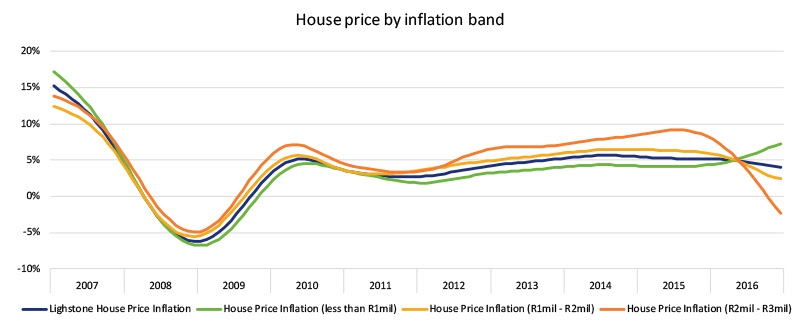
So, based on the downward movement in 2016 of the mid-value and luxury bands, which serve as leading indicators, we strongly believe that national house price inflation will follow the same trajectory in 2017. The question is, to what extent will the index slow down? To answer that question, we need to examine a few other factors.
CPI, GDP and interest rates
“It’s all good and well looking at trends, but the property market doesn’t exist in a vacuum. To start nailing some numbers down, we need to look at what’s happening in the economy as a whole,” says Paul-Roux.
The economic outlook for 2017 remains pretty bleak with estimated economic growth ranging between 0,6% and 1,2%. Consensus seems to be on inflation (CPI) settling at about 5,5% for the year, which should leave interest rates unchanged. However, as witnessed in the not-so-distant past, none of these numbers are cast in stone. We therefore created three scenarios – based on assumptions around CPI, GDP and interest rates – to generate a low-level, expected and high-level forecast for house price inflation in 2017.
The three scenarios applied CPI growth of between 5% and 6,5%; GDP growth of between 0,4% and 1,8%, and a repo rate increase of between 0 and 50 basis points.
The scenario modelled predicted that house price inflation would end 2017 at 0,2% in the low-level forecast, 1,3% in the mid-level and 2,3% in the high-level forecast, depending on the economic factors set out above.

Paul-Roux says “inflation of around 1,3% is the most likely scenario, continuing the year-on-year downward trend that has seen the house price inflation index dropping dramatically in the past two or three years.”
As to when the trend will start to reverse, there are no indicators to help with that prediction. Inflation in the luxury price brand is still dropping. Until we see a turnaround there, we should expect the current downward trend to continue. Good news if you’re buying. Less exciting for sellers. And current homeowners are continuing to lose real value in their properties – a rather bleak picture.


CN&CO 2.0: nimble and nomadic
After nearly five happy years operating under our current business model, CN&CO will start doing

Welcome new partners!
A hearty welcome on board to the Financial Intermediaries’ Association (FIA), Bidvest Insurance an

Small bites for small kids: Food for thought from Thai Africa
“Alone we can do so little. Together we can do so much” – Helen Keller During the month of